Data Visualization

Exploratory Data Analysis (EDA) is an essential first step of every project for gaining an all-round understanding of the dataset. Matplotlib or Seaborn was used to build simple graphs, charts, and plots for data visualization. Alternatively, I used Spotfire or Tableau to create a more sophisticated dashboard when required
Case 1 (matplotlib or seaborn): E-commerce Analysis
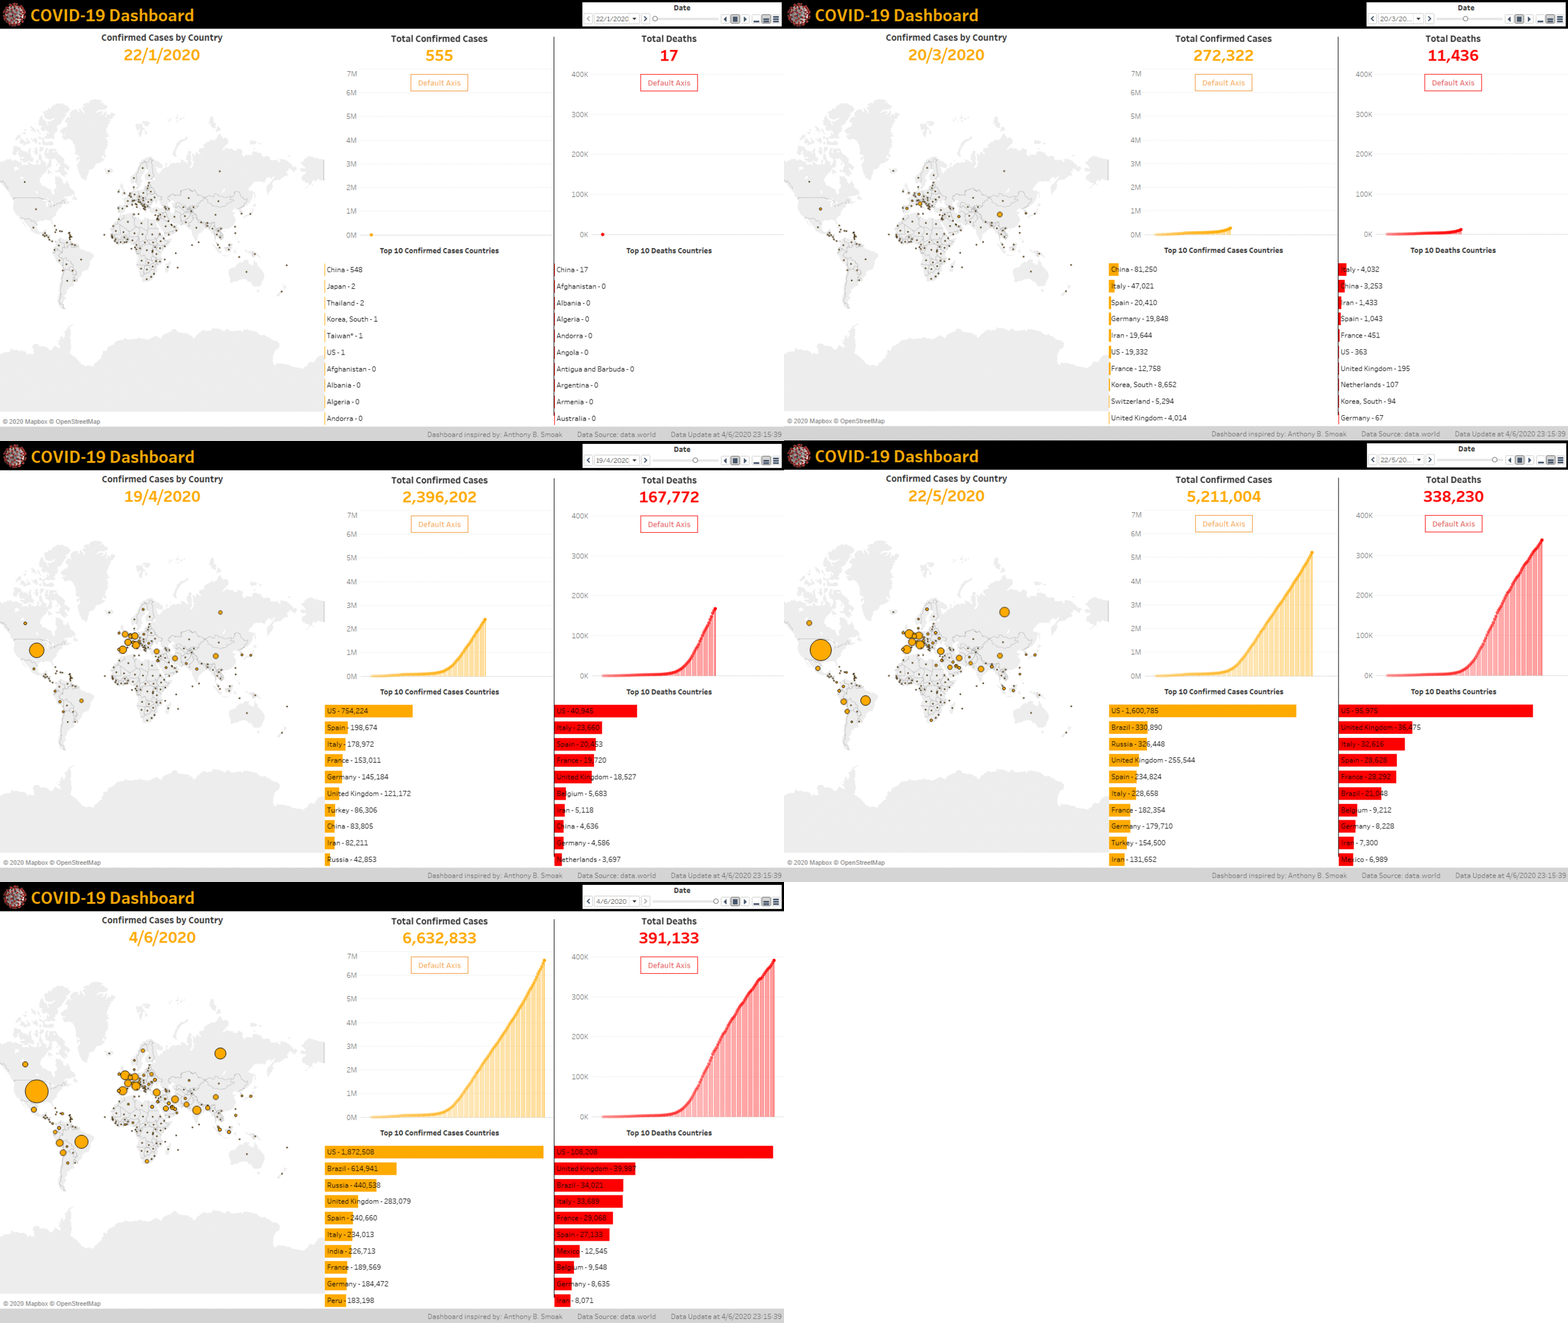
Case 2 (Tableau): Global COVID-19 Dashboard (old)
Case3 (Tableau): Global COVID-19 Dashboard (updated)
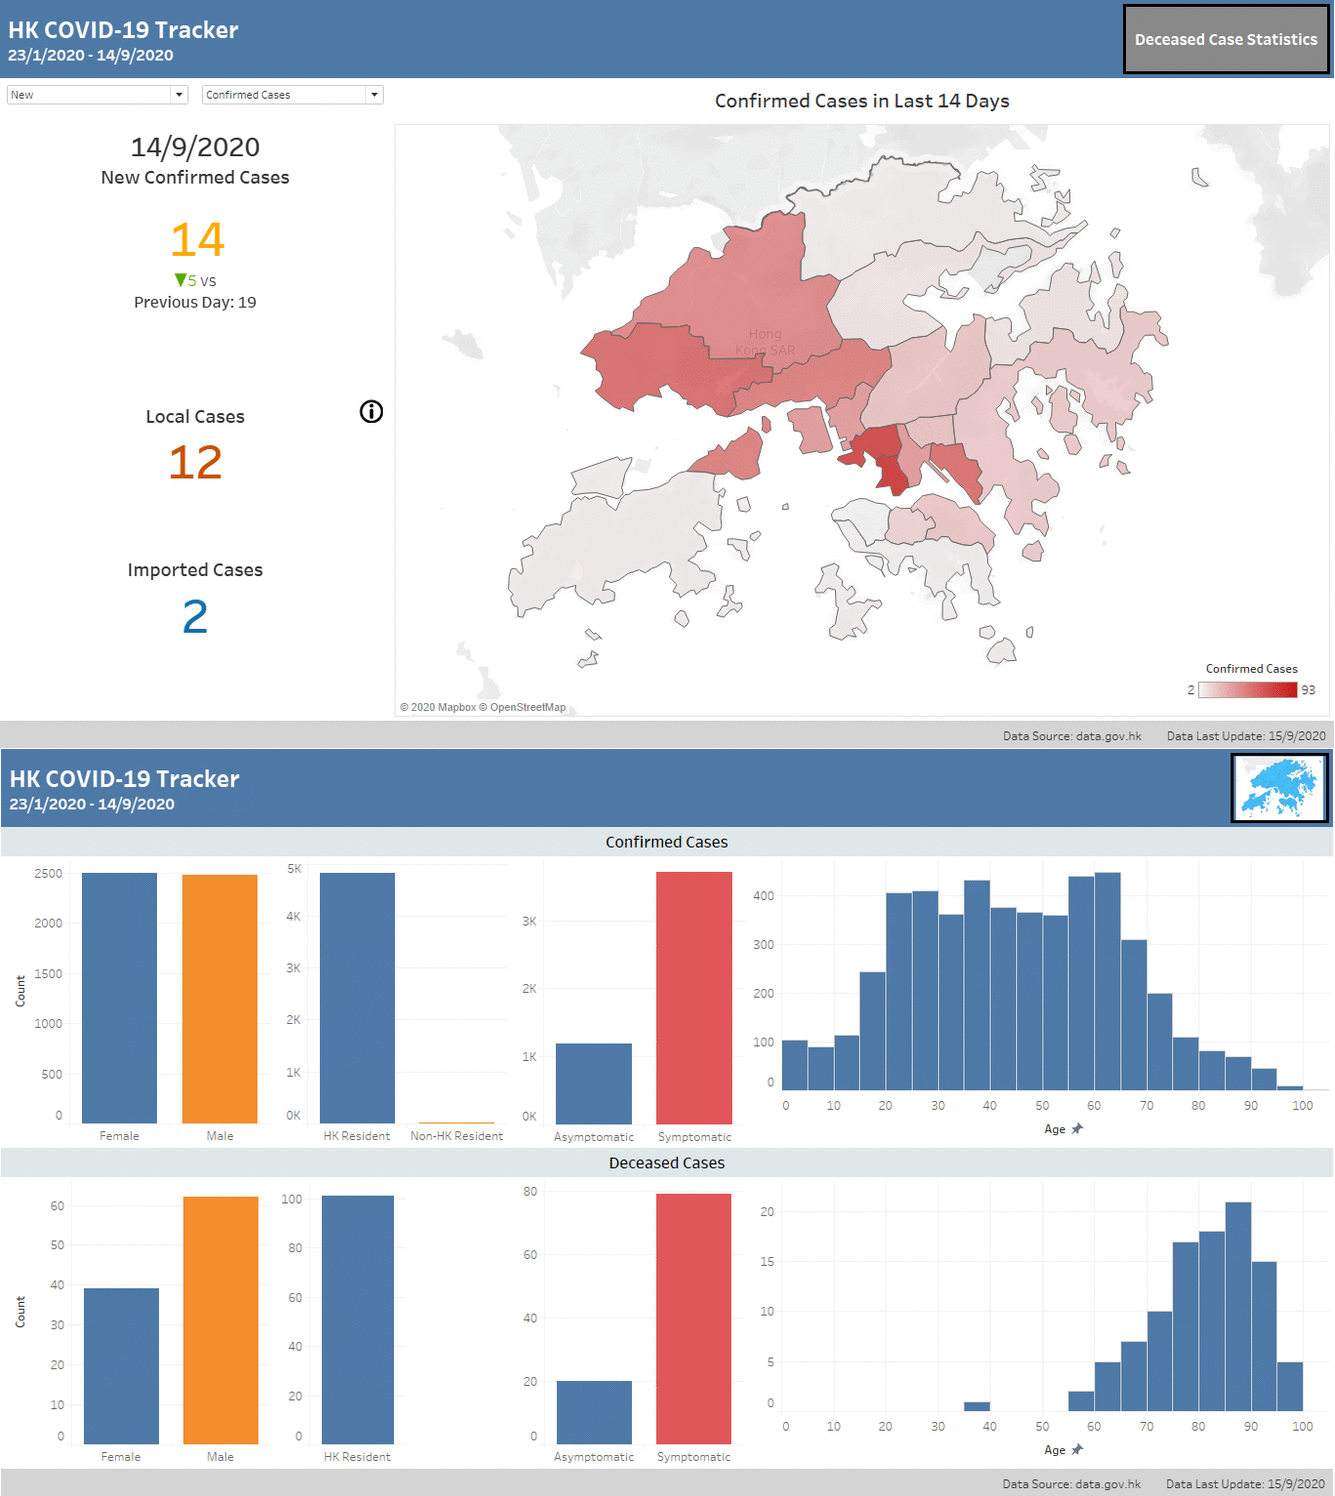
Case4 (Tableau): HK COVID-19 Dashboard

